Likert Scale Examples: Get Surveys Right (Avoid 90% Failure)
Great! You’re interested in creating a survey using the Likert scale.
You’ve nailed your product, your website is converting, and your customers are raving fans. But how do you quantify that customer love?
Enter the Likert scale, SurveySlack. This simple yet powerful tool lets you measure attitudes and opinions, giving you data-driven insights to take your business to the next level with a free survey template (proven).
Whether you’re a seasoned marketer or just starting out, understanding the Likert scale is essential for success.
Let’s break down what a Likert scale is, how to use it, what are likert scale examples, and why it’s so valuable. You’ll be decoding insights like a pro in no time.
In this post, we’ll cover:
- What is a Likert Scale Definition?
- What are Likert Scale Questions and Examples?
- 5-Point Likert Scale Examples
- 7 Point Likert Scale Examples
What is a Likert Scale Definition?
A Likert scale is a five-point or seven-point question. Social psychologist Rensis Likert developed it in 1932. It allows survey makers to measure people’s opinions and levels of agreement.

Likert scales are a way to scale attitudes. They let respondents show agreement, disagreement, or neutrality.
They are widely used in fields like psychology, sociology, and market research. They use numbers to measure non-numeric data well.
Likert scales are a good way to measure customer sentiment. They cover attitudes, opinions, and perceptions. These affect how much a customer likes a product or service.
A Statista study says Likert scales usually consist of 5, 7, or 11 attributes. They are crucial for understanding customer sentiment.
Surveys gauge opinions and attitudes using tools like an online poll maker and online form builder, often including a training survey to gather feedback effectively.
Must Read (Don’t Miss):
- 5 Best Types of Survey Questions [2025]
- 30+ Family Reunion Survey Questions You NEED to Ask!
- 150+ Best Icebreaker Questions: The ONLY List You Need!
- 150+ Mental Health Survey Questions: ASK THESE To Save Lives
What are Likert Scale Questions and Examples?
A Likert scale questionnaire is a popular method used to measure attitudes, opinions, or behaviors. It involves Likert scale questions, examples where respondents rate their level of agreement or disagreement with statements on a scale. Common scale question examples include both 5-point and 7-point Likert scales, which vary in the number of response options.
Below are some Likert scale question examples: It will show you when to use them in market research and what insights they can give.
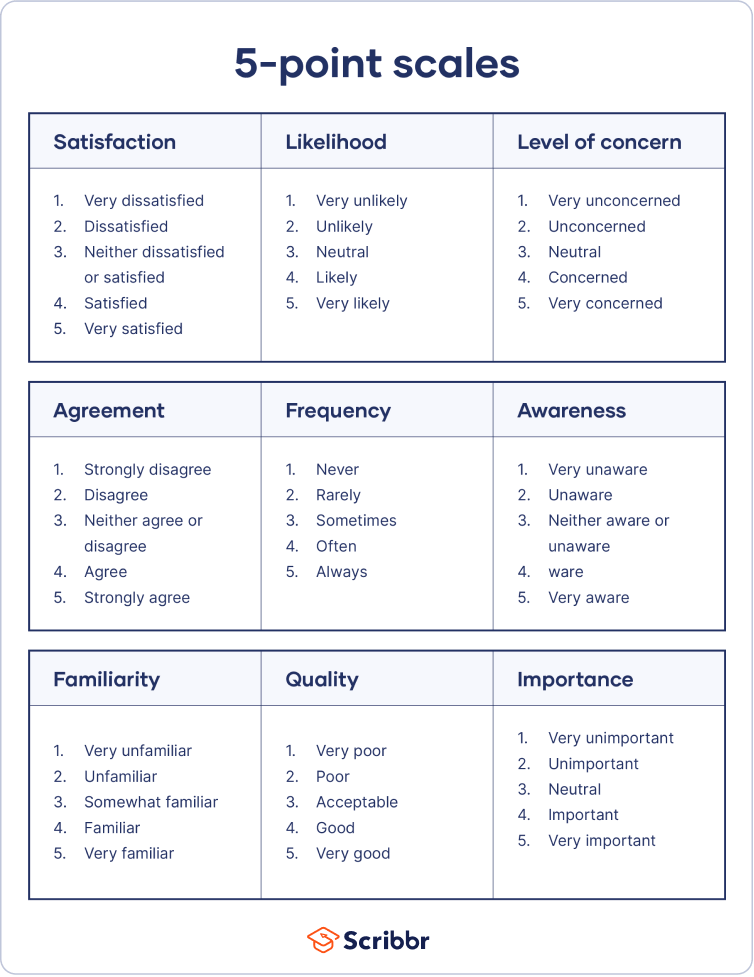
5-Point Likert Scale Examples
5-Point Likert scale examples typically include options such as “Strongly Agree,” “Agree,” “Neutral,” “Disagree,” and “Strongly Disagree.” These scales are ideal for gauging a respondent’s opinion or feelings on a topic with a moderate range of choices. Common Likert scale questionnaire items might ask about customer satisfaction, product preferences, or agreement with certain statements.
Service Quality
How would you rate the quality of our service?
- 1 – Very Poor
- 2 – Poor
- 3 – Average
- 4 – Good
- 5 – Excellent
Product Satisfaction
How satisfied are you with your recent purchase?
- 1 – Very Dissatisfied
- 2 – Dissatisfied
- 3 – Neutral
- 4 – Satisfied
- 5 – Very Satisfied
Brand Perception
To what extent do you agree with the statement: ‘This brand is trustworthy’?
- 1 – Strongly Disagree
- 2 – Disagree
- 3 – Neutral
- 4 – Agree
- 5 – Strongly Agree
Likelihood to Purchase
How likely are you to buy from us again?
- 1 – Very Unlikely
- 2 – Unlikely
- 3 – Neutral
- 4 – Likely
- 5 – Very Likely
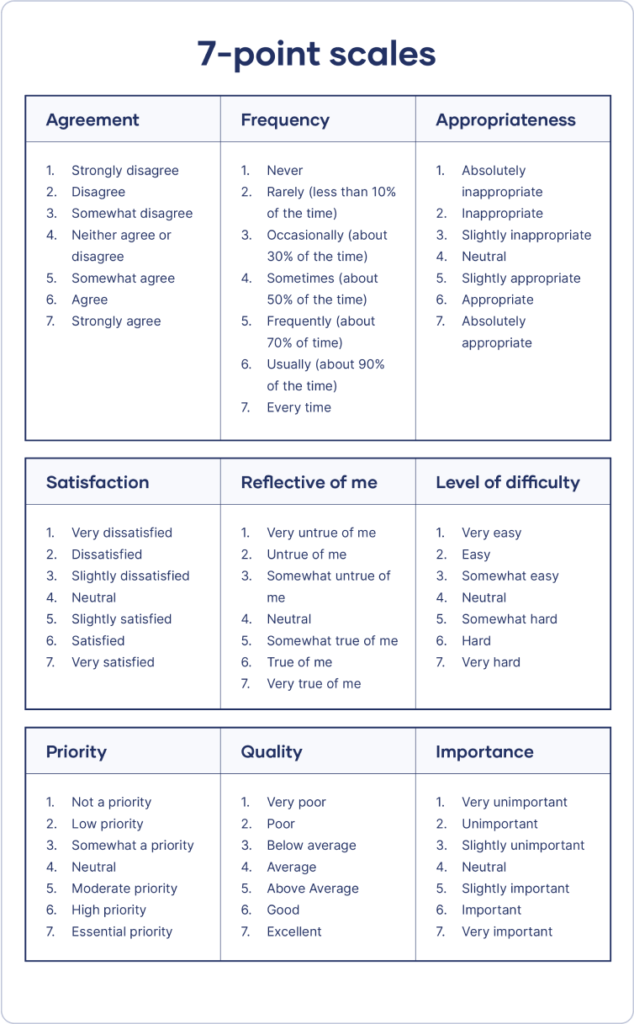
7 Point Likert Scale Examples
On the other hand, 7 Point likert scale examples offer a broader range of responses, allowing for a more nuanced view of respondent opinions. These scales might include options like “Strongly Agree,” “Agree,” “Somewhat Agree,” “Neutral,” “Somewhat Disagree,” “Disagree,” and “Strongly Disagree.” The Likert scale survey can capture subtle differences in attitudes or perceptions, making it more sensitive to variations in responses.
Customer Satisfaction
How satisfied are you with our product?
- 1 – Very Dissatisfied
- 2 – Dissatisfied
- 3 – Somewhat Dissatisfied
- 4 – Neutral
- 5 – Somewhat Satisfied
- 6 – Satisfied
- 7 – Very Satisfied
Brand Loyalty
How likely are you to recommend our brand to others?
- 1 – Very Unlikely
- 2 – Unlikely
- 3 – Somewhat Unlikely
- 4 – Neutral
- 5 – Somewhat Likely
- 6 – Likely
- 7 – Very Likely
Product Quality
To what extent do you agree with the statement: ‘This product meets my expectations’?
- 1 – Strongly Disagree
- 2 – Disagree
- 3 – Somewhat Disagree
- 4 – Neutral
- 5 – Somewhat Agree
- 6 – Agree
- 7 – Strongly Agree
Customer Experience
How would you rate your overall experience with our customer service?
- 1 – Very Poor
- 2 – Poor
- 3 – Fair
- 4 – Neutral
- 5 – Good
- 6 – Very Good
- 7 – Excellent
Incorporating 7-point and 5-point likert scale examples into your market research can significantly enhance your understanding of customer attitudes and behaviors. By utilizing these scales effectively, you can gather actionable insights that drive informed decision-making and improve overall business performance.
50+ Likert Scale Examples by Industry and Use Case
Employee Satisfaction & HR Surveys
Example 1: Job Satisfaction Scale “I am satisfied with my current job responsibilities.”
- Strongly Disagree
- Disagree
- Neither Agree nor Disagree
- Agree
- Strongly Agree
Example 2: Work-Life Balance Assessment “My workplace allows me to maintain a healthy work-life balance.”
- Completely False
- Mostly False
- Sometimes True/Sometimes False
- Mostly True
- Completely True
Example 3: Management Effectiveness “My direct supervisor provides clear guidance and feedback.”
- Never
- Rarely
- Sometimes
- Often
- Always
Example 4: Workplace Culture Evaluation “I feel valued and appreciated by my organization.”
- Strongly Disagree
- Disagree
- Neutral
- Agree
- Strongly Agree
Example 5: Training and Development “The company provides adequate opportunities for professional growth.”
- Strongly Disagree
- Disagree
- Neither Agree nor Disagree
- Agree
- Strongly Agree
Customer Satisfaction & Feedback
Example 6: Product Quality Assessment “The product quality met my expectations.”
- Strongly Disagree
- Disagree
- Neither Agree nor Disagree
- Agree
- Strongly Agree
Example 7: Customer Service Experience “How satisfied were you with our customer service?”
- Very Dissatisfied
- Dissatisfied
- Neither Satisfied nor Dissatisfied
- Satisfied
- Very Satisfied
Example 8: Purchase Likelihood “How likely are you to purchase from us again?”
- Extremely Unlikely
- Unlikely
- Neither Likely nor Unlikely
- Likely
- Extremely Likely
Example 9: Brand Recommendation (Net Promoter Score) “How likely are you to recommend our brand to others?”
- 0-2: Extremely Unlikely
- 3-4: Unlikely
- 5-6: Neutral
- 7-8: Likely
- 9-10: Extremely Likely
Example 10: Website Usability “Our website is easy to navigate.”
- Strongly Disagree
- Disagree
- Neither Agree nor Disagree
- Agree
- Strongly Agree
Academic Research & Education
Example 11: Learning Effectiveness “The course material was presented clearly.”
- Strongly Disagree
- Disagree
- Neither Agree nor Disagree
- Agree
- Strongly Agree
Example 12: Student Engagement “I actively participated in class discussions.”
- Never
- Rarely
- Sometimes
- Often
- Always
Example 13: Technology Adoption “I feel comfortable using new educational technology.”
- Strongly Disagree
- Disagree
- Neither Agree nor Disagree
- Agree
- Strongly Agree
Example 14: Research Methodology Confidence “I understand how to apply statistical analysis to research data.”
- Not at all Confident
- Slightly Confident
- Moderately Confident
- Very Confident
- Extremely Confident
Example 15: Instructor Effectiveness “The instructor was well-prepared for each class.”
- Never
- Rarely
- Sometimes
- Often
- Always
Healthcare & Patient Satisfaction
Example 16: Treatment Satisfaction “I am satisfied with the medical treatment I received.”
- Very Dissatisfied
- Dissatisfied
- Neither Satisfied nor Dissatisfied
- Satisfied
- Very Satisfied
Example 17: Communication Quality “Healthcare providers explained my condition clearly.”
- Strongly Disagree
- Disagree
- Neither Agree nor Disagree
- Agree
- Strongly Agree
Example 18: Facility Cleanliness “The healthcare facility was clean and well-maintained.”
- Poor
- Fair
- Good
- Very Good
- Excellent
Example 19: Wait Times “The wait time for my appointment was reasonable.”
- Strongly Disagree
- Disagree
- Neither Agree nor Disagree
- Agree
- Strongly Agree
Example 20: Pain Level Assessment “Rate your current pain level.”
- No Pain (1)
- Mild Pain (2-3)
- Moderate Pain (4-6)
- Severe Pain (7-8)
- Extreme Pain (9-10)
Marketing & Brand Research
Example 21: Brand Awareness “I am familiar with [Brand Name] products.”
- Not at all Familiar
- Slightly Familiar
- Moderately Familiar
- Very Familiar
- Extremely Familiar
Example 22: Advertisement Effectiveness “This advertisement influenced my purchase decision.”
- Strongly Disagree
- Disagree
- Neither Agree nor Disagree
- Agree
- Strongly Agree
Example 23: Price Perception “The product is reasonably priced for its quality.”
- Strongly Disagree
- Disagree
- Neither Agree nor Disagree
- Agree
- Strongly Agree
Example 24: Social Media Engagement “I regularly interact with brands on social media.”
- Never
- Rarely
- Sometimes
- Often
- Always
Example 25: Purchase Frequency “How often do you purchase products in this category?”
- Never
- Rarely (1-2 times per year)
- Sometimes (3-6 times per year)
- Often (7-12 times per year)
- Very Often (More than 12 times per year)
Product Development & User Experience
Example 26: Feature Usefulness “This feature adds value to the product.”
- Strongly Disagree
- Disagree
- Neither Agree nor Disagree
- Agree
- Strongly Agree
Example 27: Interface Design “The user interface is intuitive and easy to use.”
- Strongly Disagree
- Disagree
- Neither Agree nor Disagree
- Agree
- Strongly Agree
Example 28: Performance Satisfaction “The product performs as expected.”
- Far Below Expectations
- Below Expectations
- Meets Expectations
- Above Expectations
- Far Above Expectations
Example 29: Mobile App Usability “The mobile app is responsive and functions smoothly.”
- Never
- Rarely
- Sometimes
- Often
- Always
Example 30: Innovation Perception “This product represents innovative thinking.”
- Not at all Innovative
- Slightly Innovative
- Moderately Innovative
- Very Innovative
- Extremely Innovative
Event & Conference Evaluation
Example 31: Overall Event Satisfaction “Overall, I was satisfied with the event.”
- Very Dissatisfied
- Dissatisfied
- Neither Satisfied nor Dissatisfied
- Satisfied
- Very Satisfied
Example 32: Speaker Quality “The speakers were knowledgeable and engaging.”
- Strongly Disagree
- Disagree
- Neither Agree nor Disagree
- Agree
- Strongly Agree
Example 33: Venue Appropriateness “The venue was suitable for this type of event.”
- Completely Inappropriate
- Mostly Inappropriate
- Somewhat Appropriate
- Mostly Appropriate
- Completely Appropriate
Example 34: Networking Opportunities “The event provided valuable networking opportunities.”
- Not at all Valuable
- Slightly Valuable
- Moderately Valuable
- Very Valuable
- Extremely Valuable
Example 35: Future Attendance “I would attend this event again in the future.”
- Definitely Not
- Probably Not
- Might or Might Not
- Probably Yes
- Definitely Yes
Restaurant & Hospitality
Example 36: Food Quality “The food quality met my expectations.”
- Far Below Expectations
- Below Expectations
- Meets Expectations
- Above Expectations
- Far Above Expectations
Example 37: Service Speed “The service was prompt and efficient.”
- Strongly Disagree
- Disagree
- Neither Agree nor Disagree
- Agree
- Strongly Agree
Example 38: Atmosphere Rating “The restaurant atmosphere was pleasant.”
- Very Unpleasant
- Unpleasant
- Neither Pleasant nor Unpleasant
- Pleasant
- Very Pleasant
Example 39: Value for Money “The meal was good value for the price paid.”
- Poor Value
- Fair Value
- Good Value
- Very Good Value
- Excellent Value
Example 40: Return Likelihood “I would recommend this restaurant to others.”
- Definitely Not
- Probably Not
- Might or Might Not
- Probably Yes
- Definitely Yes
Technology & Software
Example 41: Software Reliability “The software rarely crashes or experiences technical issues.”
- Never True
- Rarely True
- Sometimes True
- Often True
- Always True
Example 42: Feature Completeness “The software includes all the features I need.”
- Strongly Disagree
- Disagree
- Neither Agree nor Disagree
- Agree
- Strongly Agree
Example 43: Learning Curve “The software was easy to learn and use.”
- Extremely Difficult
- Difficult
- Neither Easy nor Difficult
- Easy
- Extremely Easy
Example 44: Technical Support “Technical support responses are helpful and timely.”
- Never
- Rarely
- Sometimes
- Often
- Always
Example 45: Update Frequency “Software updates improve functionality.”
- Strongly Disagree
- Disagree
- Neither Agree nor Disagree
- Agree
- Strongly Agree
Additional Specialized Examples
Example 46: Environmental Consciousness “I consider environmental impact when making purchases.”
- Never
- Rarely
- Sometimes
- Often
- Always
Example 47: Financial Confidence “I feel confident about my financial future.”
- Not at all Confident
- Slightly Confident
- Moderately Confident
- Very Confident
- Extremely Confident
Example 48: Communication Preference “I prefer digital communication over face-to-face interaction.”
- Strongly Disagree
- Disagree
- Neither Agree nor Disagree
- Agree
- Strongly Agree
Example 49: Innovation Adoption “I am usually among the first to try new products or services.”
- Never
- Rarely
- Sometimes
- Often
- Always
Example 50: Community Involvement “I actively participate in community activities.”
- Not at all Active
- Slightly Active
- Moderately Active
- Very Active
- Extremely Active
Best Practices for Creating Effective Likert Scales
1. Choose the Optimal Number of Points
5-Point Scales: Most common and user-friendly
- Pros: Easy to understand, good reliability, sufficient differentiation
- Cons: May lack precision for detailed analysis
- Best for: General surveys, customer satisfaction, employee feedback
7-Point Scales: Increased precision
- Pros: More nuanced responses, better for statistical analysis
- Cons: Can be overwhelming for some respondents
- Best for: Academic research, detailed attitude measurement
Odd vs. Even Scales:
- Odd scales (3, 5, 7): Include neutral midpoint
- Even scales (4, 6): Force respondents to lean positive or negative
2. Ensure Clear and Balanced Language
Do:
- Use parallel structure in response options
- Maintain equal intervals between points
- Include clear anchors for each point
- Test with your target audience
Don’t:
- Mix different types of scales within the same survey
- Use leading or biased language
- Create unbalanced scales (e.g., 3 positive, 1 negative option)
- Make statements too complex or double-barreled
3. Consider Cultural and Demographic Factors
Cultural Sensitivity:
- Some cultures prefer avoiding extreme responses
- Consider acquiescence bias (tendency to agree)
- Translate carefully to maintain meaning
Demographic Considerations:
- Age groups may interpret scales differently
- Education level affects comprehension
- Technology comfort influences online completion
4. Order and Presentation Matters
Response Order:
- Consistent direction (positive to negative or vice versa)
- Consider starting with positive for sensitive topics
- Randomize when testing for bias
Visual Design:
- Clear visual hierarchy
- Adequate spacing between options
- Mobile-responsive design
- Consider using radio buttons or dropdown menus
Common Likert Scale Mistakes to Avoid
1. The Double-Barreled Question Trap
❌ Wrong: “The product is high-quality and affordable.” ✅ Right: Split into two questions:
- “The product is high-quality.”
- “The product is affordable.”
2. Unbalanced Scales
❌ Wrong: Extremely Good | Very Good | Good | Fair | Poor ✅ Right: Excellent | Very Good | Good | Fair | Poor
3. Acquiescence Bias
❌ Problem: All statements are positively worded ✅ Solution: Mix positively and negatively worded items
4. Response Anchoring Issues
❌ Wrong: Vague labels like “Good” without context ✅ Right: Specific anchors like “Completely Satisfactory”
5. Scale Mixing
❌ Wrong: Using different scale types (agreement, satisfaction, frequency) inconsistently ✅ Right: Group similar scale types together with clear instructions
Advanced Likert Scale Analysis Techniques
Statistical Analysis Options
Descriptive Statistics:
- Mean and median scores
- Standard deviation
- Frequency distributions
- Mode analysis
Inferential Statistics:
- T-tests for group comparisons
- ANOVA for multiple groups
- Correlation analysis
- Regression modeling
Advanced Techniques:
- Factor analysis for construct validation
- Reliability testing (Cronbach’s alpha)
- Item-total correlations
- Rasch modeling
Data Interpretation Guidelines
Central Tendency:
- Mean scores indicate overall direction
- Median provides middle response
- Mode shows most common response
Variability:
- High standard deviation suggests disagreement
- Low standard deviation indicates consensus
- Range shows response spread
Practical Significance:
- Effect sizes beyond statistical significance
- Confidence intervals for precision
- Benchmarking against industry standards
Industry-Specific Implementation Strategies
HR and Employee Surveys
- Annual engagement surveys: Comprehensive 5-7 point scales
- Pulse surveys: Quick 3-point scales for frequent measurement
- 360-degree feedback: Multi-rater perspectives with consistent scales
- Exit interviews: Focus on satisfaction and likelihood scales
Customer Experience Management
- Post-purchase surveys: Satisfaction and likelihood scales
- Net Promoter Score (NPS): 11-point recommendation scale
- Customer effort score: Ease of interaction measurement
- Service recovery: Before/after comparison scales
Academic Research
- Attitude measurement: Multi-item scales with validation
- Behavioral intention: Likelihood and frequency scales
- Construct development: Multiple indicators per construct
- Cross-cultural studies: Culturally adapted scales
Market Research
- Brand perception: Awareness and preference scales
- Purchase intention: Likelihood and frequency measures
- Product testing: Quality and satisfaction assessments
- Advertising effectiveness: Recall and influence measurement
Technology Integration and Tools
Survey Platform Features
Modern survey platforms like SurveySlack offer:
- Pre-built templates: Industry-specific likert scale questions
- Smart logic: Conditional questioning based on responses
- Real-time analytics: Instant data visualization
- Multi-device compatibility: Consistent experience across devices
- Integration capabilities: Connect with CRM and analytics tools
Mobile Optimization
- Responsive design: Adapts to screen sizes
- Touch-friendly interfaces: Easy selection on mobile devices
- Offline capabilities: Continue surveys without internet
- Progressive web apps: App-like experience in browsers
Data Export and Analysis
- Multiple formats: CSV, XLSX, SPSS, R
- Real-time dashboards: Live updating results
- Statistical packages: Built-in analysis tools
- API integration: Custom data workflows
Future Trends in Likert Scale Research
Emerging Technologies
AI-Powered Analysis:
- Sentiment analysis of open-ended responses
- Predictive modeling for future responses
- Automated insight generation
- Bias detection and correction
Voice and Conversational Surveys:
- Voice-activated survey completion
- Chatbot-administered likert scales
- Natural language processing for responses
- Emotional tone analysis
Methodological Innovations
Adaptive Questioning:
- Dynamic scale selection based on responses
- Personalized question ordering
- Real-time difficulty adjustment
- Optimized survey length
Multi-Modal Data Collection:
- Combining likert scales with behavioral data
- Physiological response integration
- Social media sentiment correlation
- Environmental context consideration
FAQs About Likert Scale Examples
What is a Likert scale?
A Likert scale is a survey question format that measures respondents’ levels of agreement or disagreement with a statement.
What are the benefits of using a Likert scale?
- Simple and easy to understand for respondents.
- Provide measurable data for analysis and comparison.
- Reduce response bias compared to yes/no questions.
How many points should a Likert scale have?
Common Likert scales have 5, 7, or 9 points. Five points are good for a quick survey, while 7 or 9 points allow for more nuanced responses.
Should I include a neutral midpoint option?
Yes, including a neutral point (“Neither Agree nor Disagree”) is recommended. This allows respondents who don’t have a strong opinion to reflect their sentiments accurately.
How do I write good Likert scale questions?
- Keep questions clear, concise, and focused on a single concept.
- Avoid double-barreled questions that ask about two things at once.
- Phrase statements to be neutral and unbiased.
Final Thoughts
The Likert scale is valuable for researchers. It helps gauge opinions and attitudes. It offers a simple way to collect data. It is effective and goes beyond a yes/no response, providing a spectrum of feelings. However, it’s important to know the limits. Respondents have a limited understanding of the scale. Also, the data is ordinal.
Carefully craft Likert scale questions or Likert questionnaires to consider their potential drawbacks. You can use them to gain valuable insights from surveys. Now, it’s time to put these questions into action! Tools like SurveySlack.com can help you craft engaging surveys that truly make a difference.
![Likert scale: Meaning, Questions, Examples & More [2025]](https://surveyslack.com/wp-content/uploads/2024/06/Likert-scale.webp)